Fishing activity - North Atlantic

Geolocalized data

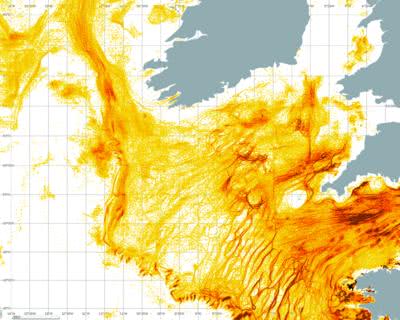
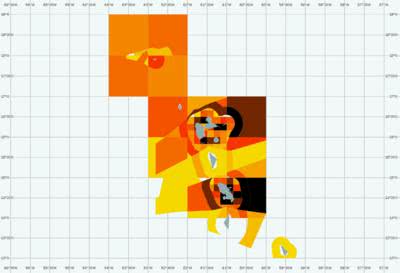
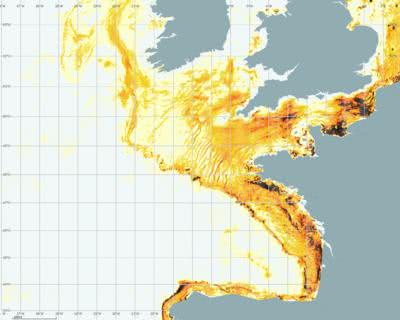
The representation of geolocalized data allows to analyze data and detect underlying structures of the measured activity at a glance.

The maps presented here, beyond the analysis of economic activity, put in evidence of the correlations between the geographical characteristics of the environment and ecosystem.

Our maps are also used in a regulatory and policy context as a management support tool.

Strengths of our tools

Interactivity : in a few clicks, the user can display the interesting information by filtering, grouping or crossing data
Easy : very easy to use, no training needed
Powerful : Our maps can display large amounts of data in very little time
Maps edition : data selection, choice of displayed quantity, layers, colors...
Animations : with a single click, our tools generate the temporal evolution of your data.
Export : pdf, png and shapes (for arcview, qgis) output
Fishing activity of european vessels - GPS data

Raw Geolocalized data

This type of mapping is the raw positions (in this case the GPS position taken at regular intervals). This representation allows a detailed analysis of data.

Fullstack ⇾ Technologies: nodejs, proj4js, gdal, postgresql, postgis, c++, image processing
Fishing activity North Atlantic - Aggregated data 10'x10'

Aggregation of geolocalized data

This type of mapping aggregates data on a regular mesh of arbitrary dimension (of the examples, mesh of 10'x10', 3'x3' and 1'x1').

Demo

This application displays fake data, and requires a recent version of Google Chrome, Firefox or Safari.

Fullstack ⇾ Technologies: nodejs, proj4js, gdal, postgresql, postgis, c++, image processing
Fishing activity in French Antilles

Aggregation of data on predefined polygons

This type of mapping aggregates data on predefined polygons (administrative areas, political areas, regulatory areas, environmental areas, ...).

Fullstack ⇾ Technologies: nodejs, proj4js, gdal, postgresql, postgis, c++, image processing

Collaborative maps building

To be really useful decision support tools, the maps need to be more than simple representations. Users need to use them as sharing and exchange support: this is the goal of our collaborative tool.

This tool allows any number of users to view the same map on different screens (possibly remotely), edit collaboratively and in real time.

Users can draw on the map, add annotations, or layers... When a user modifies his map, the modification is instantly reflected on the map of other users.

Fullstack ⇾ Technologies: polymer, nodejs, proj4js, gdal, postgresql, postgis, c++